A.L. ParkerGraphing Outrage on TwitterI must admit I’m fascinated by Twitter. Its a simple platform at heart — a microblogging site where users can post character limited…8 min read·Dec 1, 2020----
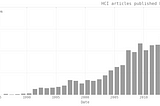
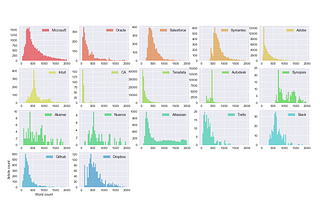
A.L. ParkerCharting publication topics with python’s matplotlibPsychology Research in Human Computer Interaction5 min read·Apr 5, 2018----
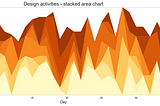
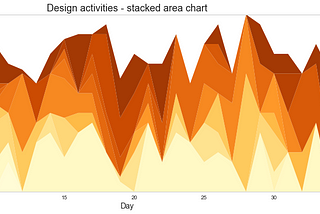
A.L. ParkerUX Design process stacked time chartsEver since I saw this excellent data visualisation of the daily routines of famous people I’ve been thinking about ways to track and…3 min read·Apr 5, 2018----
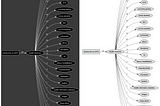
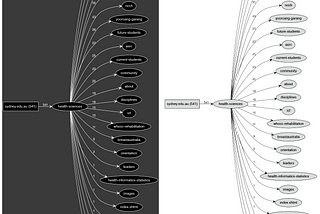
A.L. ParkerGenerating sitemap diagrams for massive websitesSoftware designers generally work on two types of projects: redesigning existing products or creating new ones from scratch. For an…5 min read·Apr 5, 2018----
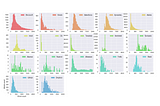
A.L. ParkerClustering documentation websitesThis was one of my first python data analysis projects. At the time I was working in the Information Experience (IX) team at Australian…4 min read·Apr 5, 2018----
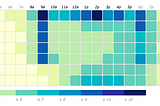
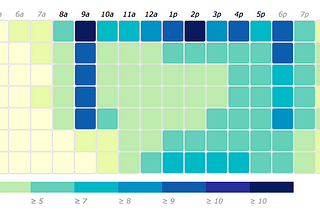
A.L. ParkerSydney transport use across the weekWhat can public transport use tell us about a city’s population? This modified D3 graph shows when Sydney-siders use different forms of…2 min read·Apr 5, 2018----